

What it looks like
What it solves
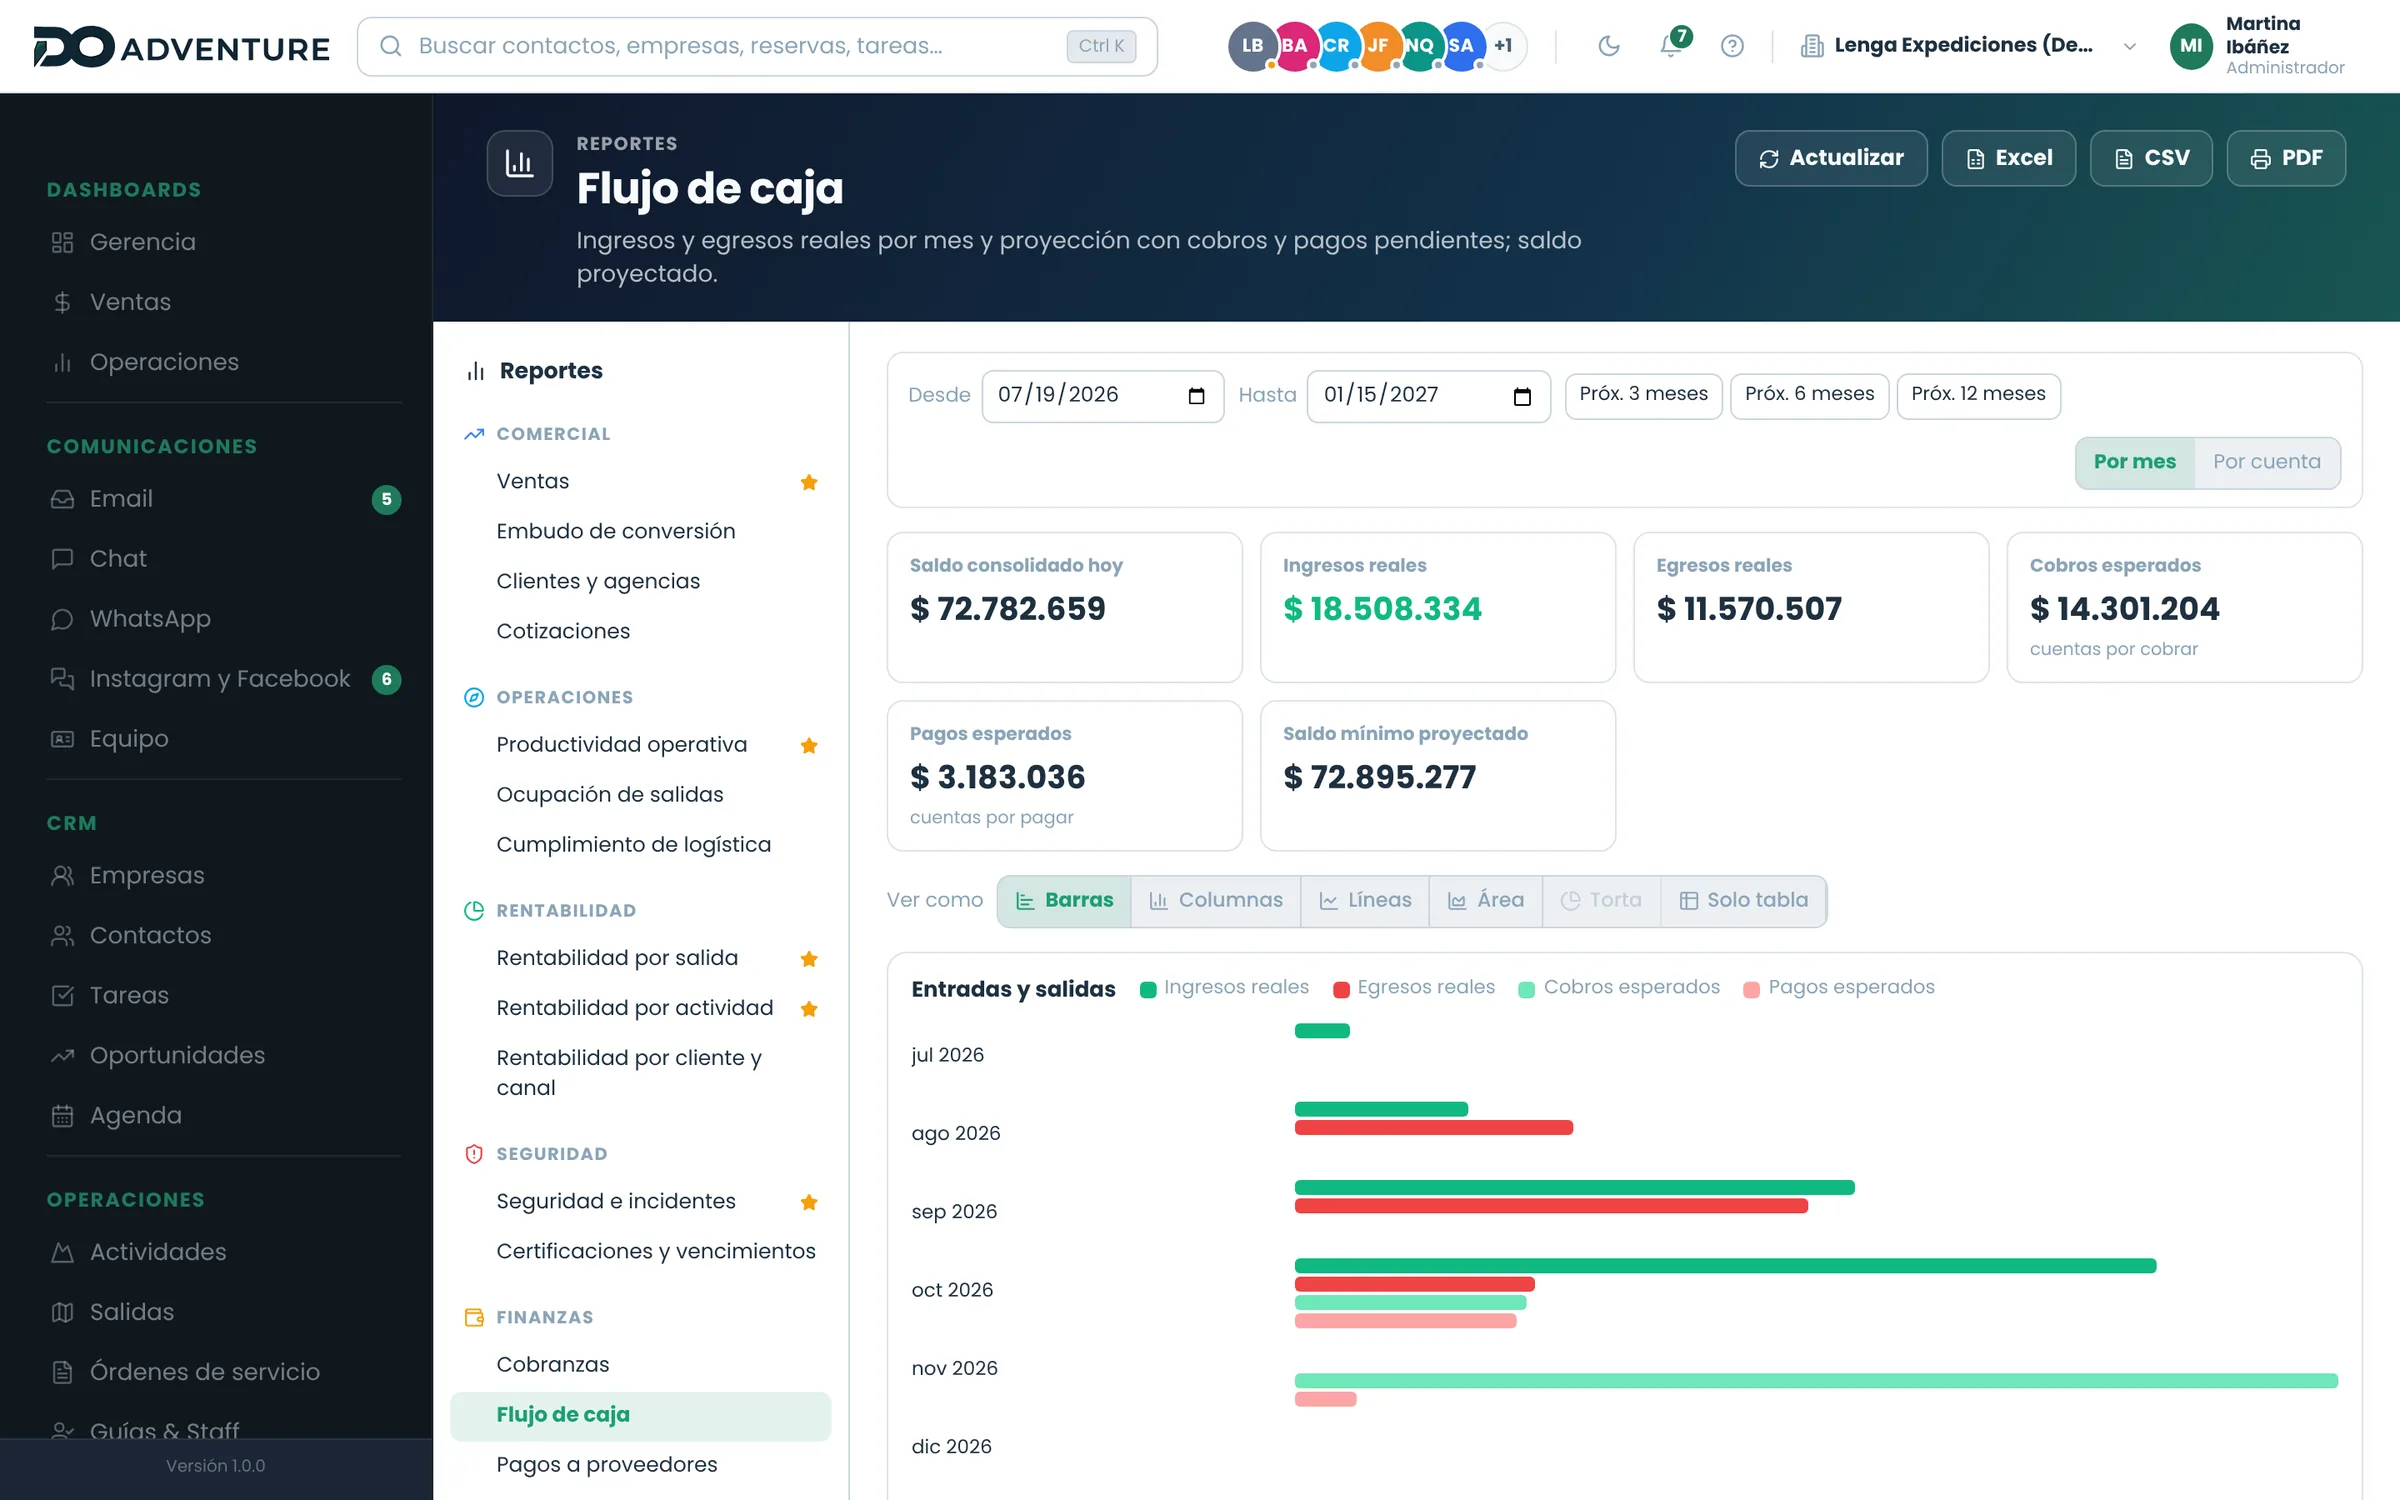
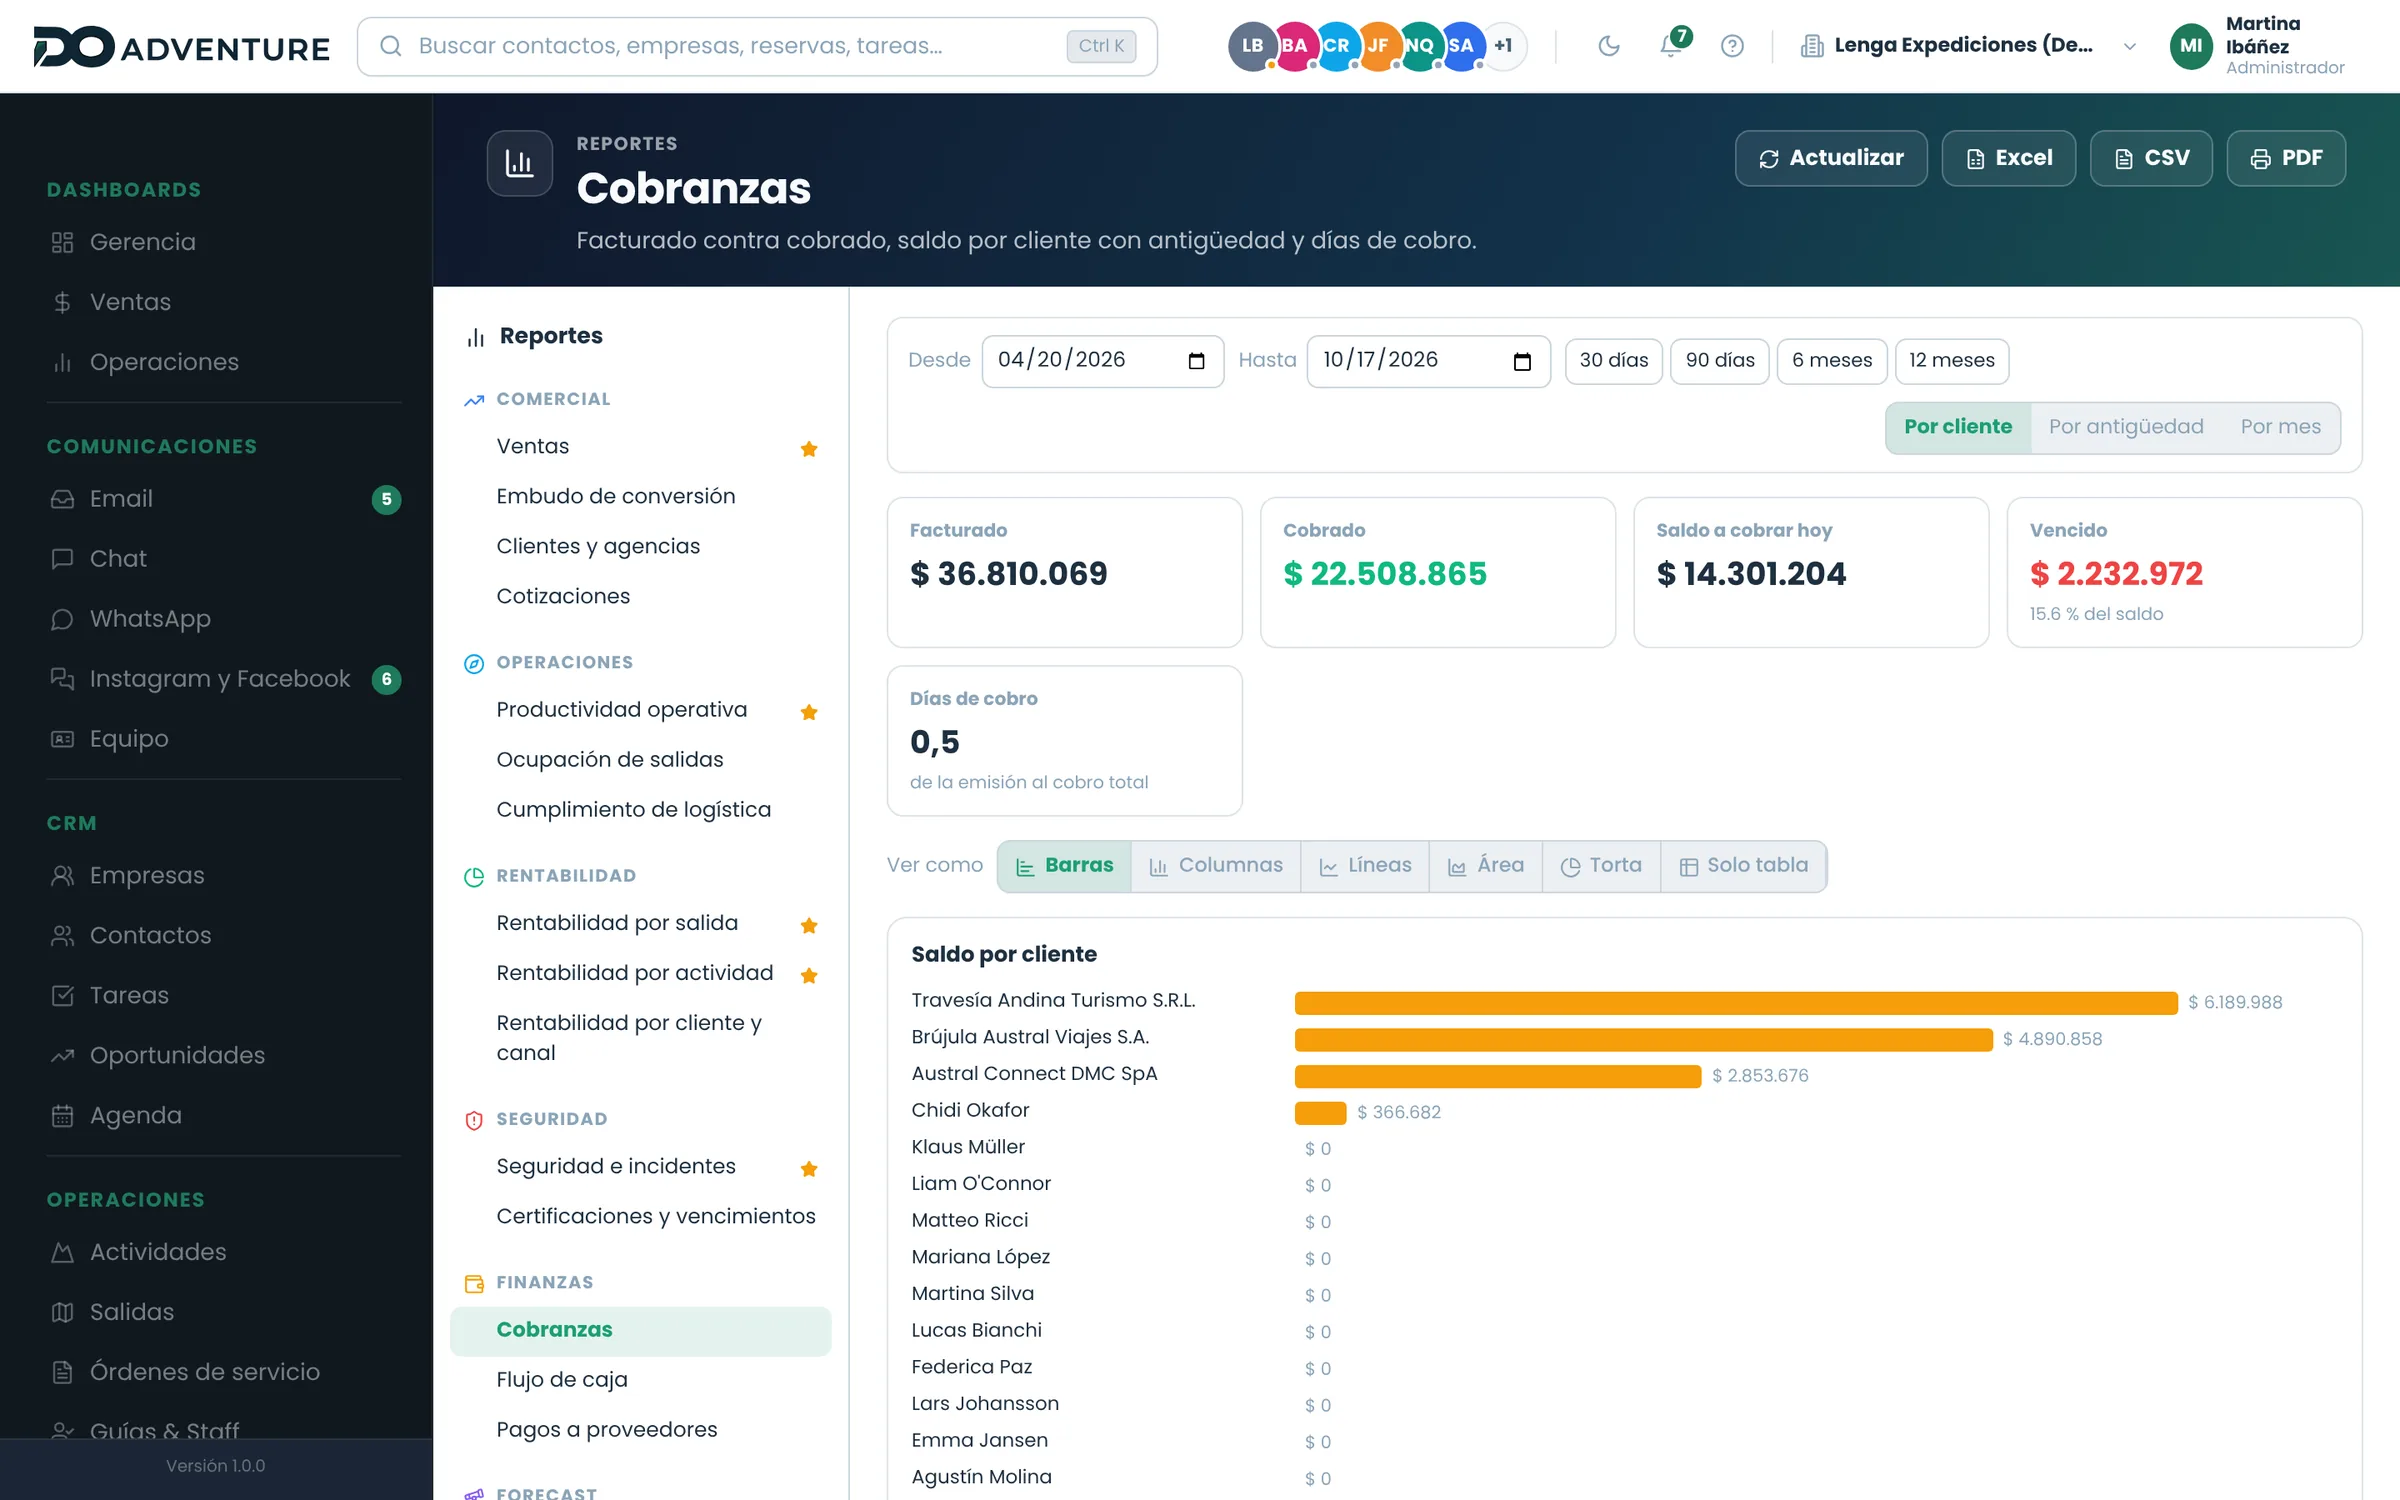
Real profitability by activity and by departure: revenue, cost and margin built from the numbers operations already entered, not from an estimate put together at the end of the month.
- Profitability by activity and by departure
- Consolidated results for the business
- Period-over-period comparison
- Connected to bookings and treasury
What you can do
- See profitability by activity and by departure
- Compare a period against the same one a year earlier
- Split revenue, cost and margin for every operation
- Spot the activities that bill well and leave no margin
- Look at the consolidated result for the business
A real case
Two activities that looked equally good
The situation
Rafting and horseback riding bill about the same in February, but one of the two leaves nothing behind.
- 01
The dashboard shows revenue for both activities: almost identical.
- 02
Right below it comes the real cost: hauling the horses and an extra guide per group eat the riding margin.
- 03
You compare this February against the previous one and see the riding margin sliding for two seasons straight.
- 04
You raise the riding rate and lower the minimum group size needed to run it.
What you end up with
You stop pushing hard on an activity that had you working for free, with the number out on the table.
Load one of your own departures and see how it looks.
No video, no guided tour: it is your account, with every module open, so you can try it on data you recognise.
15 days · no card · closes itself if you stop there