

What it looks like
What it solves
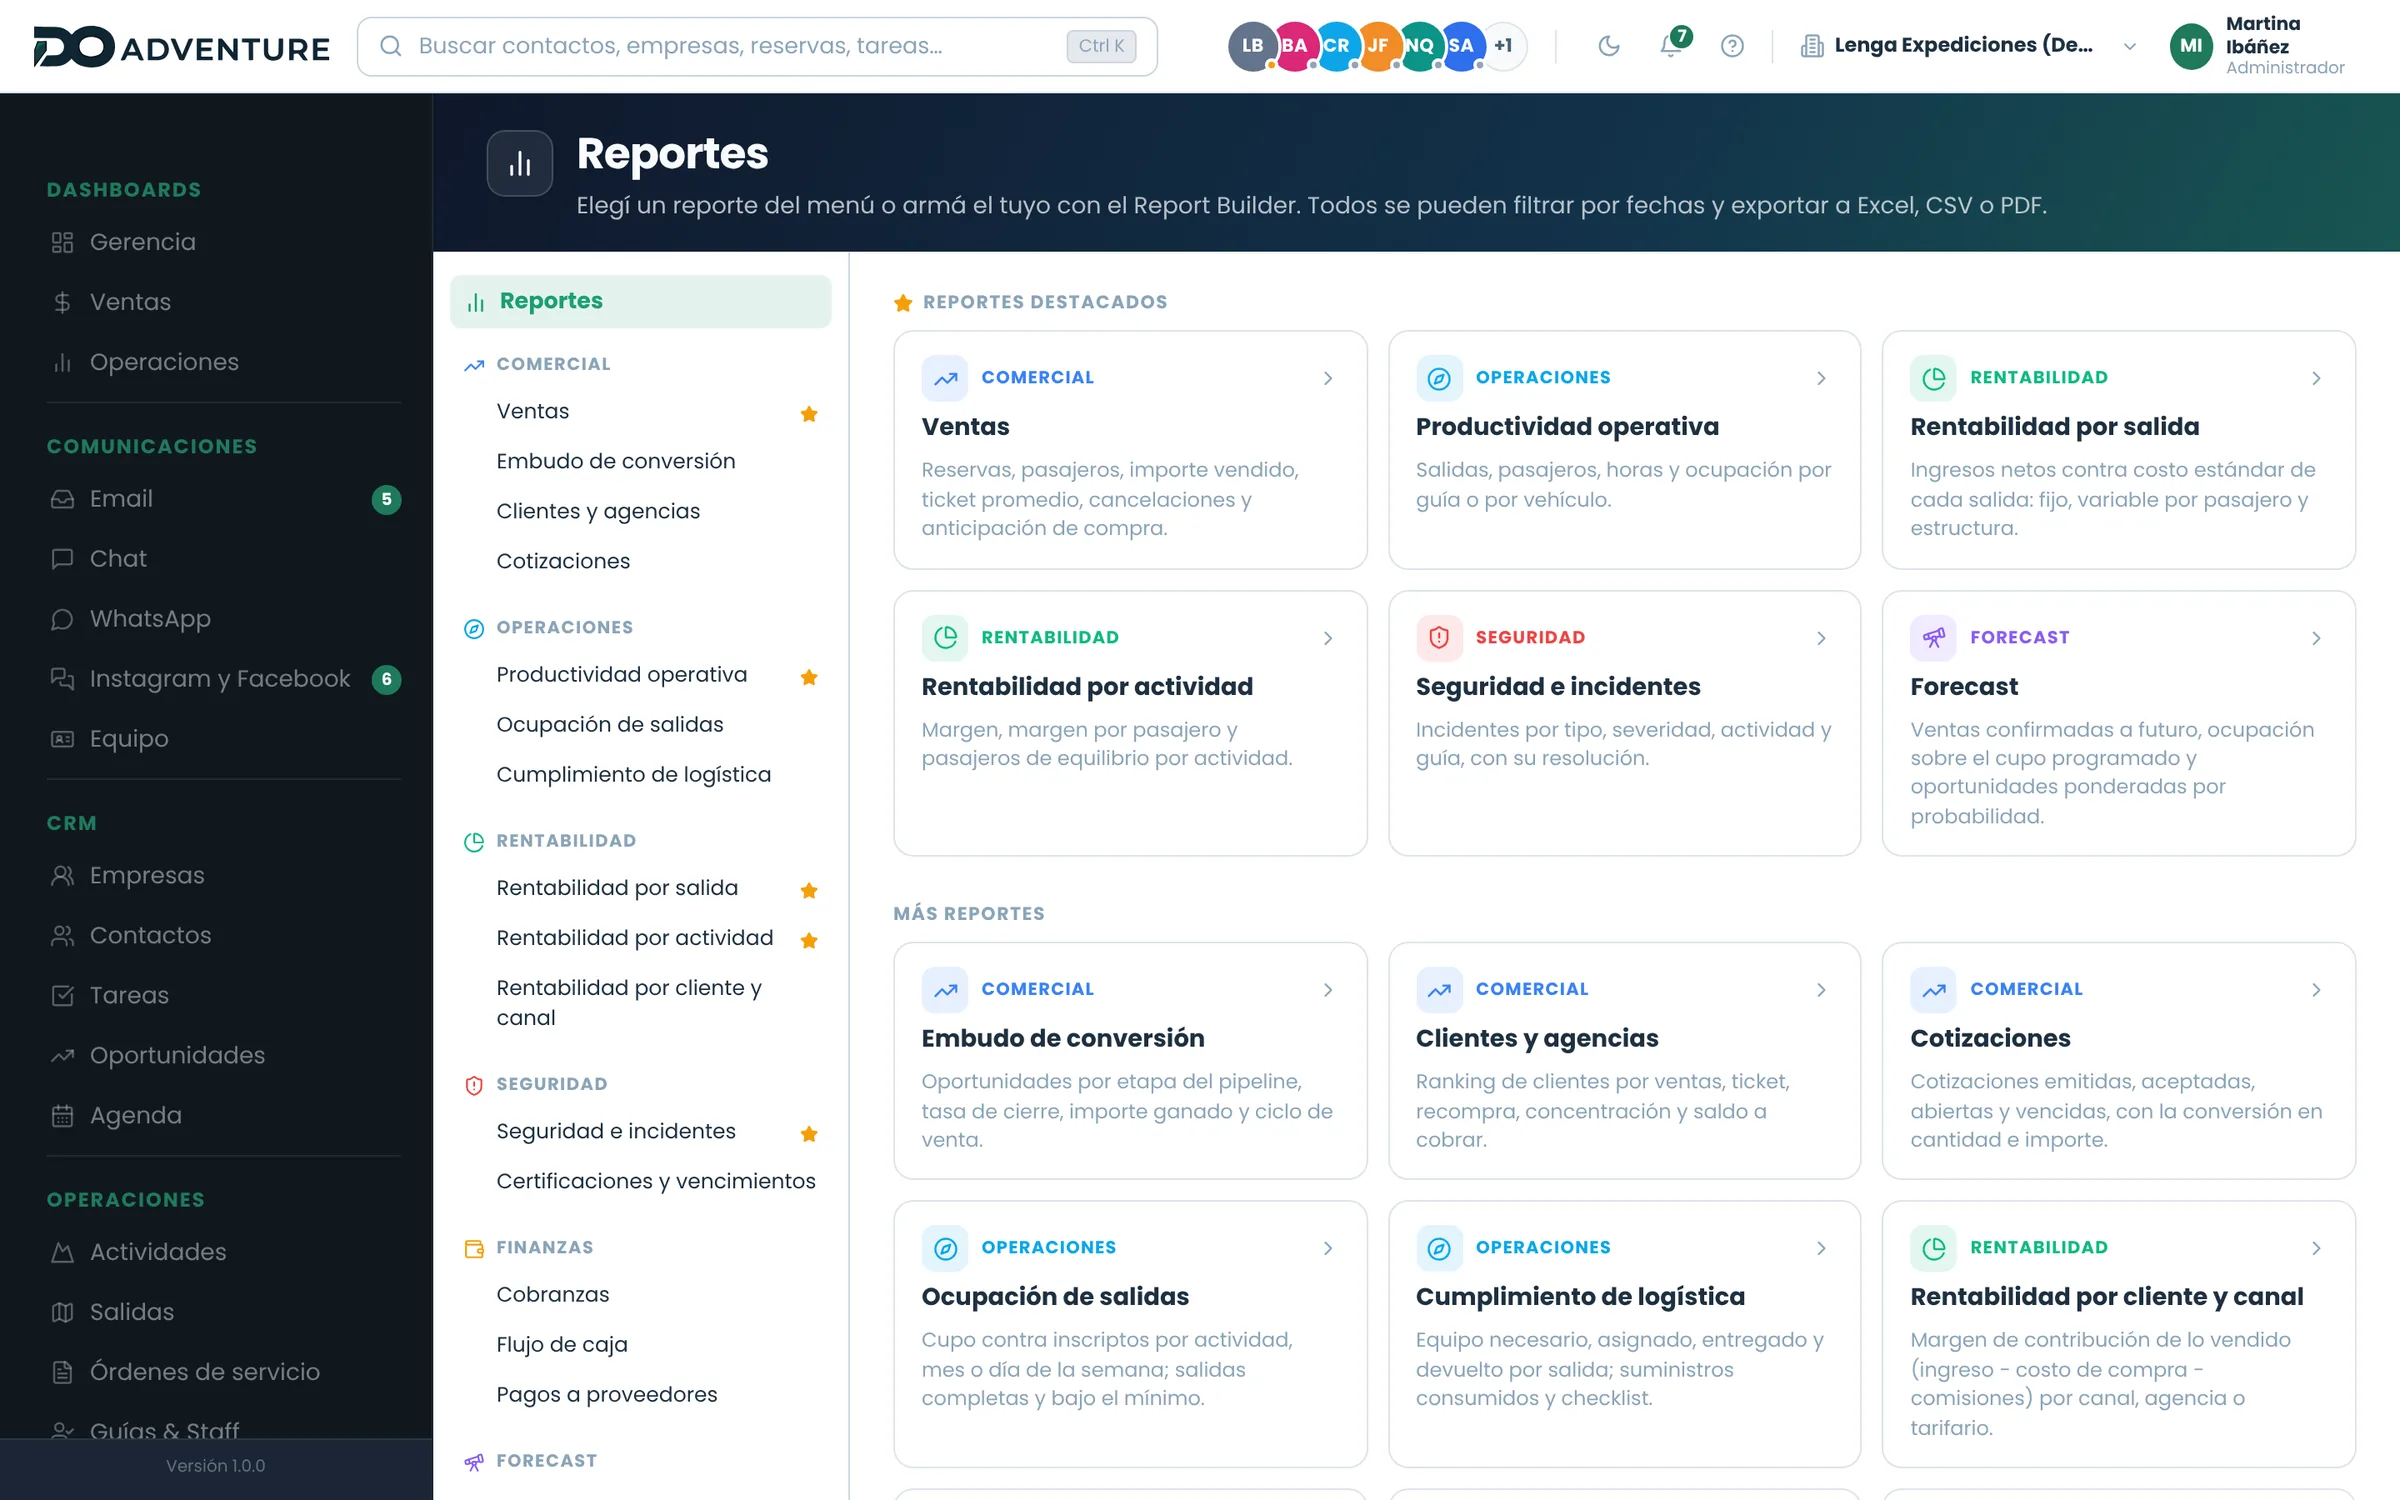
Sales, occupancy, operations and finance in reports you read on one screen and use to decide on Monday morning, not to file away.
- Sales and occupancy reports
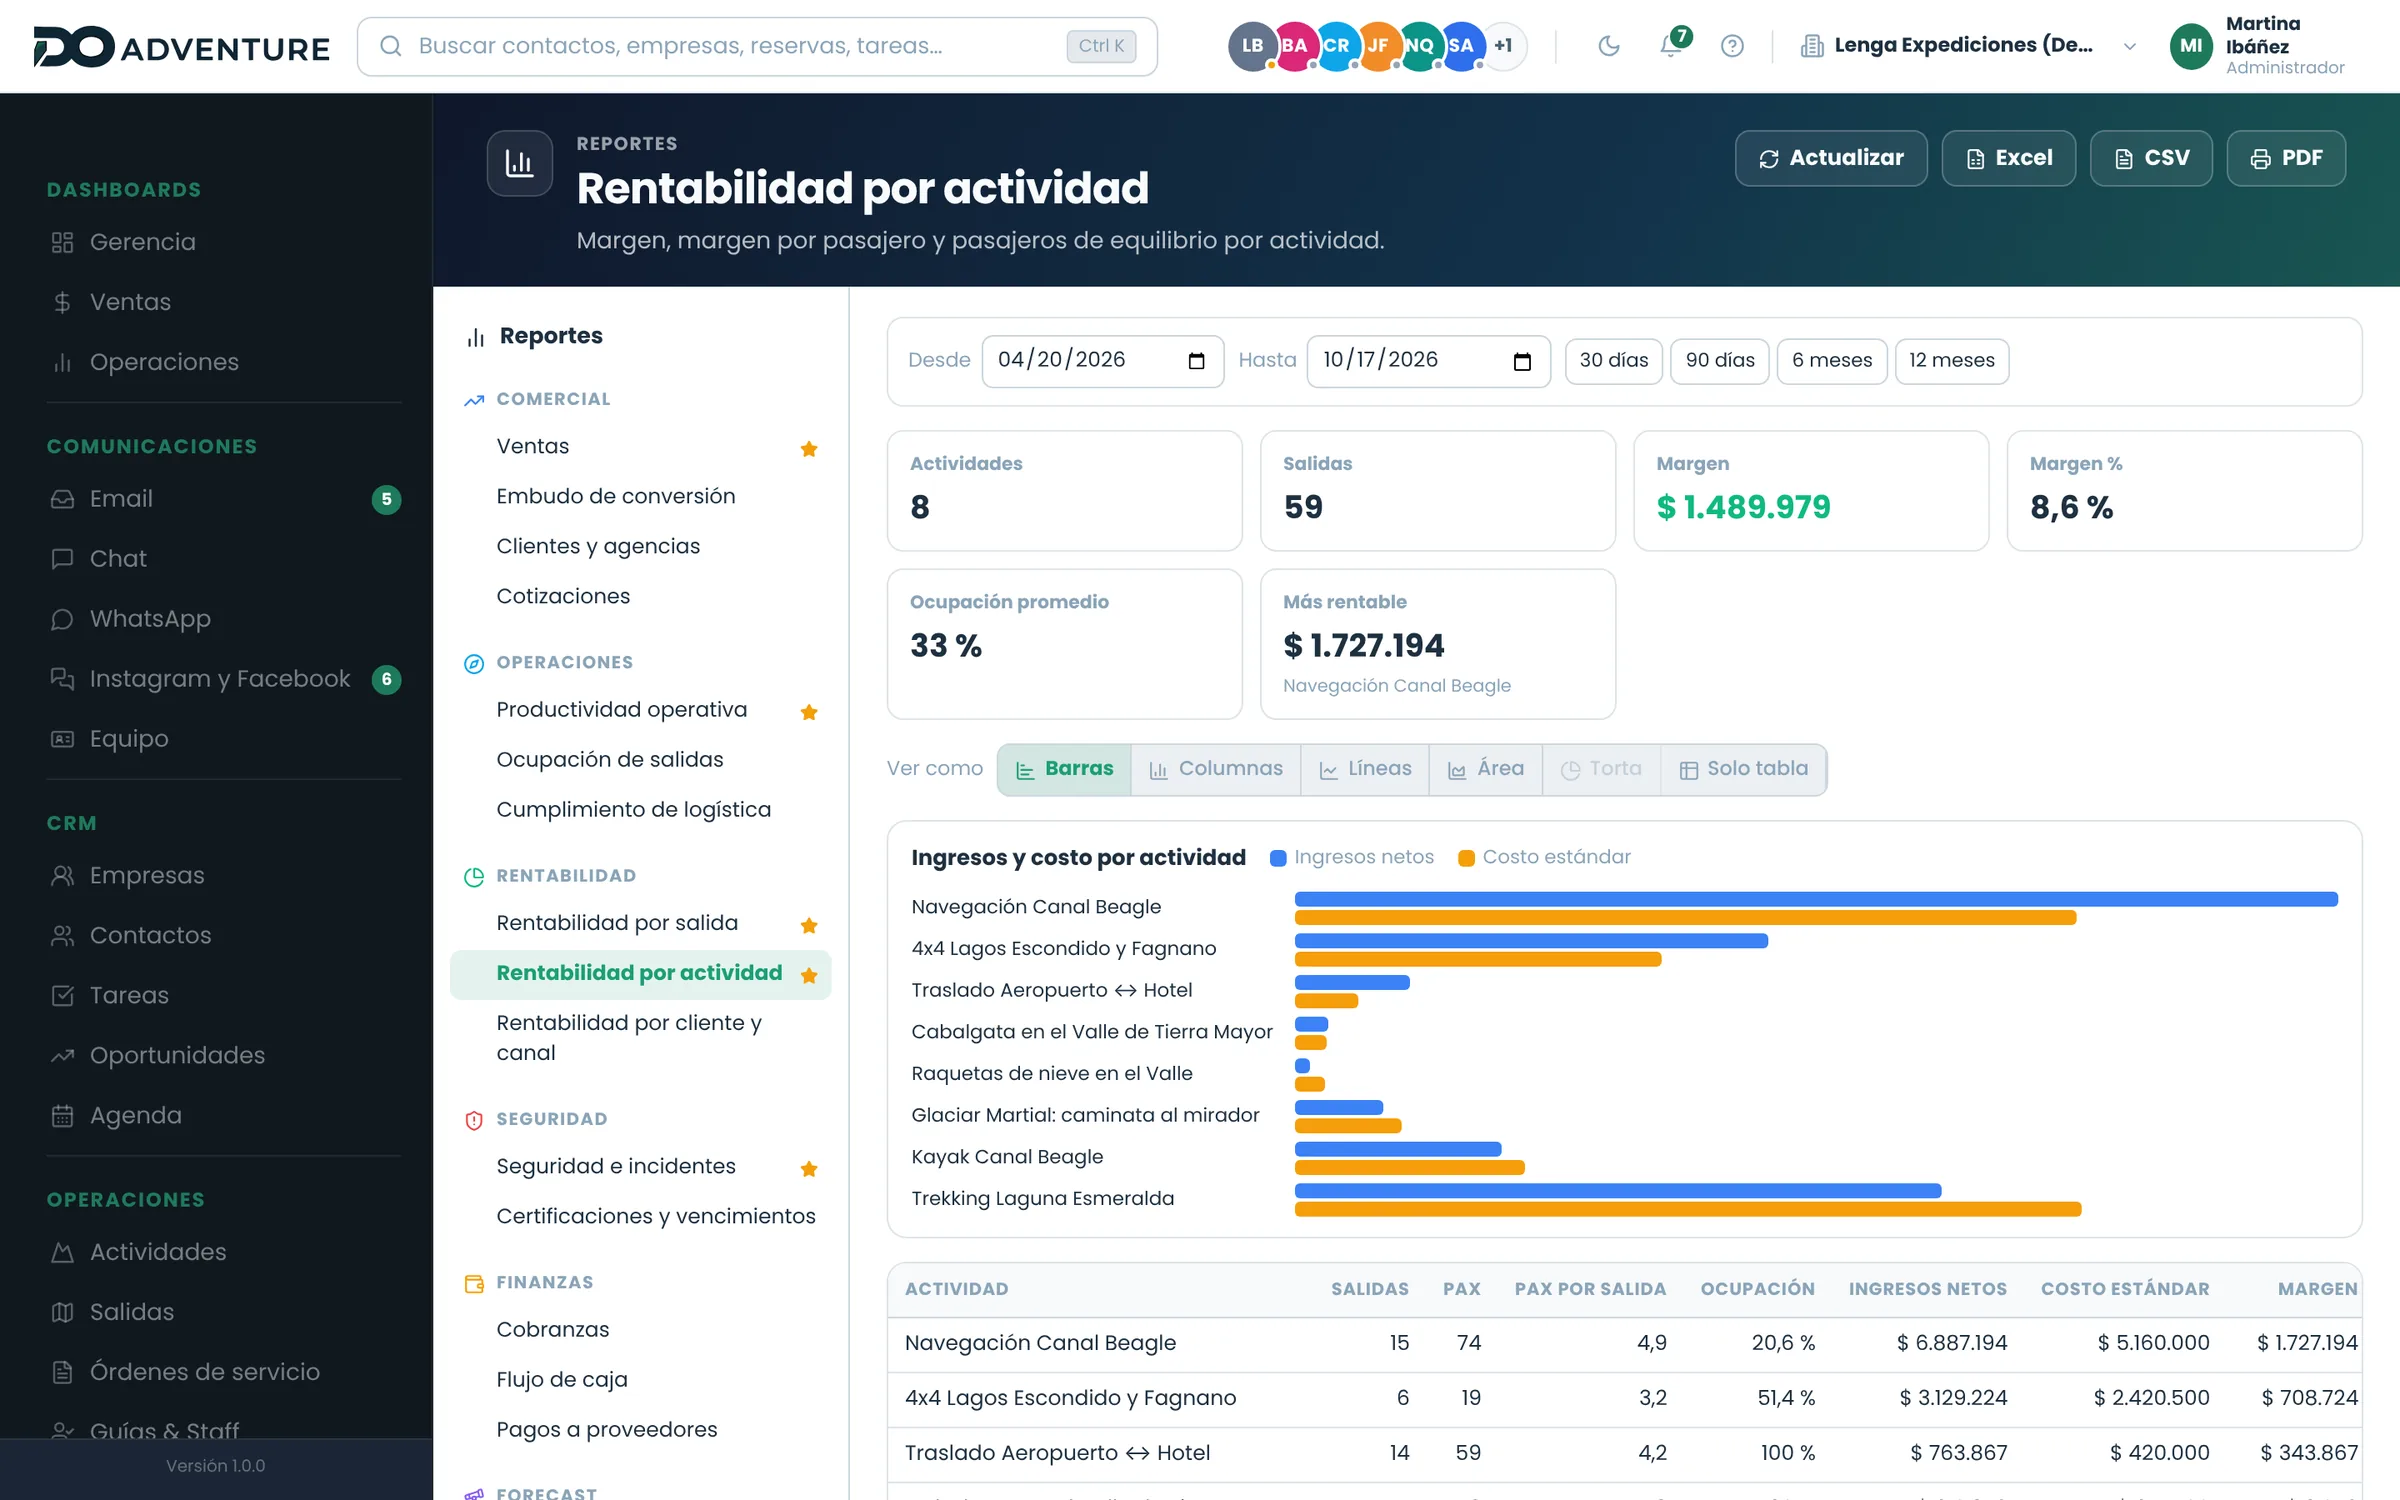
- Financial and operational reports
- Consolidated view of the business
- Figures updated in real time
15 minof meeting, with real data
Liveno waiting for the month to close
What you can do
- See how full the week's departures are
- Measure sales by channel and by salesperson
- Cross what happened in the field with what the money did
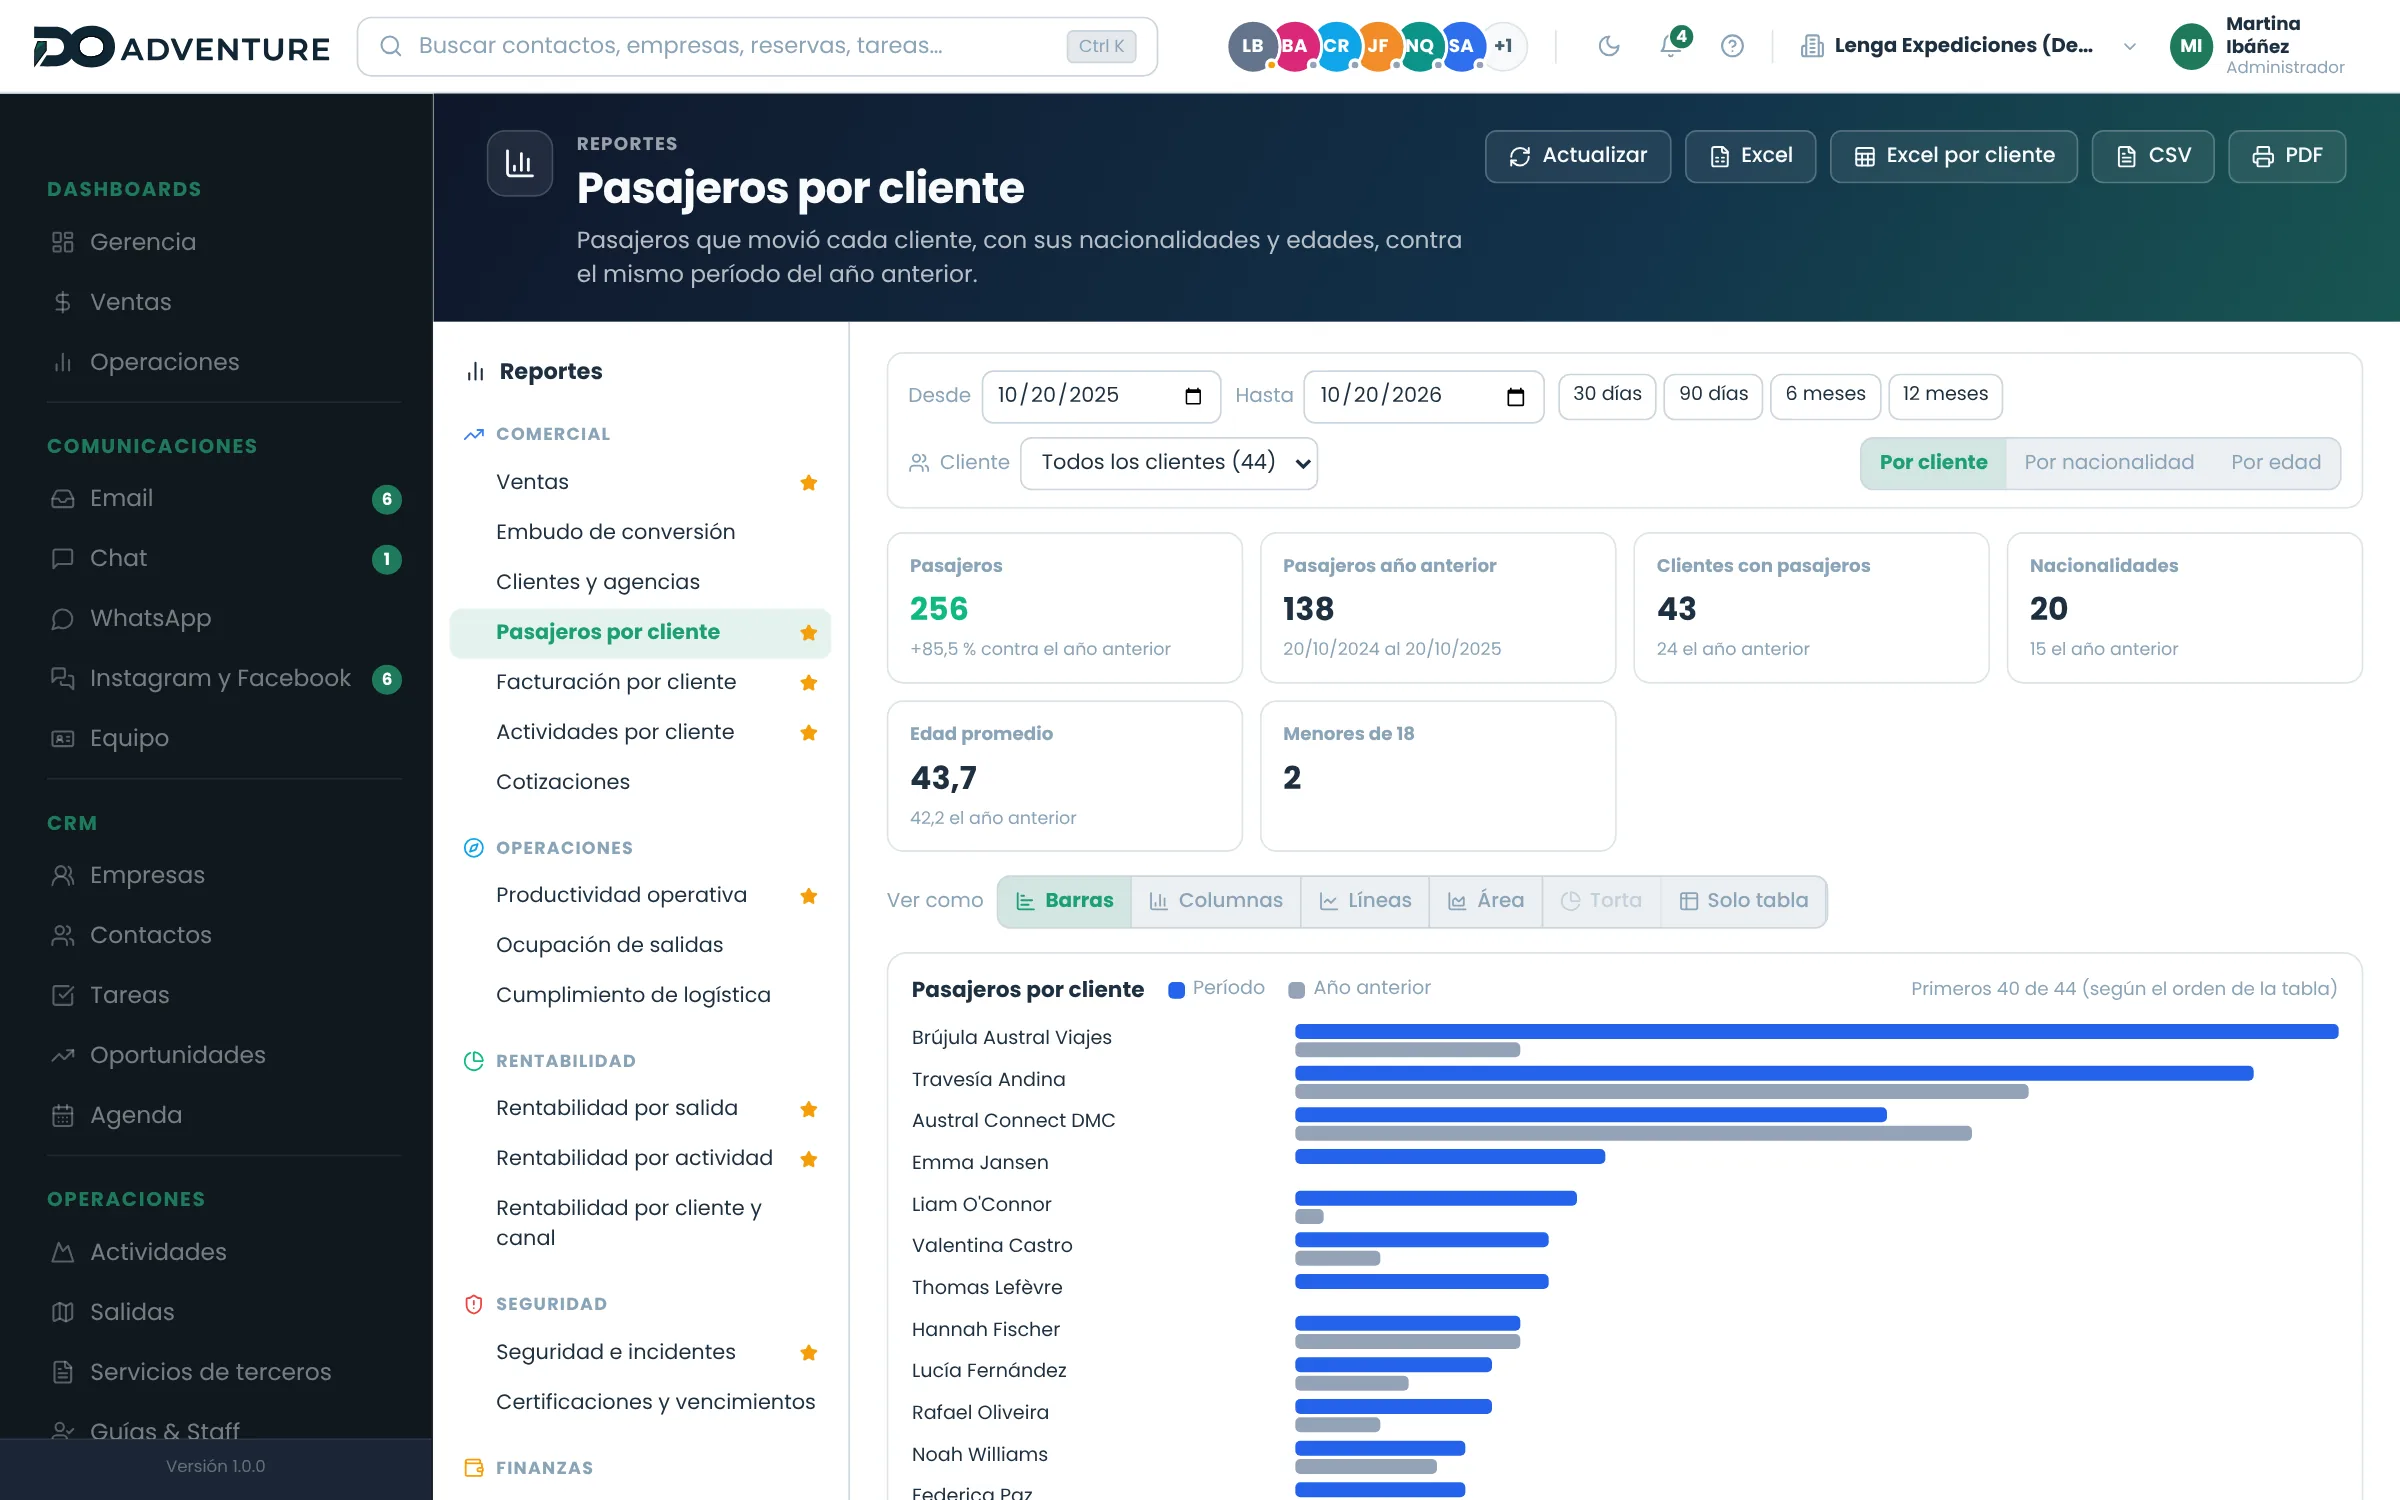
- Filter by period, activity, guide or channel
- Export exactly what you have on screen
- Compare each client's passengers, invoicing and activities against last year
A real case
The Monday nine o'clock meeting
The situation
Fifteen minutes to decide which departures hold this week and which ones get pulled.
- 01
The occupancy report lists the week's departures with how full each one is.
- 02
Three are below the minimum to run and two are at capacity.
- 03
You pull one, merge two and open an extra slot on the one that filled up.
- 04
The change shows up in availability before the meeting is over.
What you end up with
The meeting stops being a round of impressions and becomes a decision made on today's numbers.
Load one of your own departures and see how it looks.
No video, no guided tour: it is your account, with every module open, so you can try it on data you recognise.
15 days · no card · closes itself if you stop there